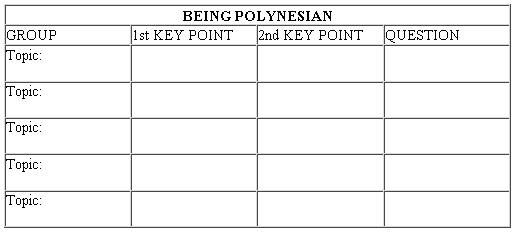
T-chart
A T-chart is a means of organising information. You may have two columns or more, depending on the information the students are organising and the learning outcomes.
Students are to read text, listen to text, view video, view images, and so on, to identify the key points and enter them into the correct column of the T-chart.
Refer to Cubitt et al (1999, p.52).
An example of a T-chart
Students complete this T-chart while listening to group presentations about 'being Polynesian in pre-European times'.

Cubitt, S., Irvine, R., Dow, A. (1999, p.52). Top Tools for Social Science Teachers. Auckland: Addison Wesley Longman. www.pearsoned.co.nz

